The pandemic took a big toll on Hawaii’s tourism industry. Global shutdowns drastically curtailed the ability for travel. Governor’s Ige decision to restrict air travel to Hawaii also reduced the number of visitors. What is interesting is that the subsequent recovery has highlighted important shifts in Hawaii’s visitor industry.
Maui has displaced Oahu as the most visited island
Oahu has traditionally been the most popular island to visit in Hawaii. After the pandemic, Maui has attracted more visitors than any other island. Table 1 shows the percentage of revenue coming from the Transient Accommodation Tax (TAT) derived from each county in the first six months of the calendar year. The TAT is a room tax of 10.25% levied on room rates for stays of 180 consecutive days or less1. Prior to the pandemic, Oahu generated 45% of TAT revenues, more than any other county. After the pandemic, Maui started to generate more TAT revenues than Oahu. Maui’s share of TAT revenue grew from 30.3% in 2018 to 40.3% in 2021. Maui’s portion of revenue fell to 37.5% in 2021, but it is still more than Oahu’s portion of revenue (35.7%).
| Year | Oahu | Maui | Hawaii | Kauai |
|---|---|---|---|---|
| 2018 | 45.4% | 30.3% | 13.9% | 10.4% |
| 2019 | 45.3% | 32.5% | 11.9% | 10.3% |
| 2020 | 45.2% | 32.5% | 12.3% | 9.9% |
| 2021 | 34.3% | 40.3% | 17.4% | 8.0% |
| 2022 | 35.7% | 37.5% | 15.5% | 11.4% |
A decline in Asian visitors and Honolulu’s ban on Transient Vacation Rentals explain Oahu’s poor performance
There are several reasons for Maui’s strong revenue performance compared to Oahu. First, the recovery of the visitor industry has been driven by people coming from the U.S. mainland, who tend to visit neighbor islands. Oahu’s tourism industry is more dependent on international visitors from Asia (mainly Japan). Pandemic related travel restrictions by the Japanese government have limited the number of visitors to Hawaii over the last year and a half.
The recovery in visitor arrivals of mainland versus international visitors partly explains why Maui has done better than Oahu. The Japanese government ended their travel restrictions in October 2022. It is likely that Oahu will see increased TAT revenues when Asian tourists return. The economic impact of the return of Japanese visitors is uncertain however since the Japanese Yen has experienced a significant decline in value compared to the U.S. Dollar. This makes a Hawaiian vacation much more expensive for Japanese tourists.
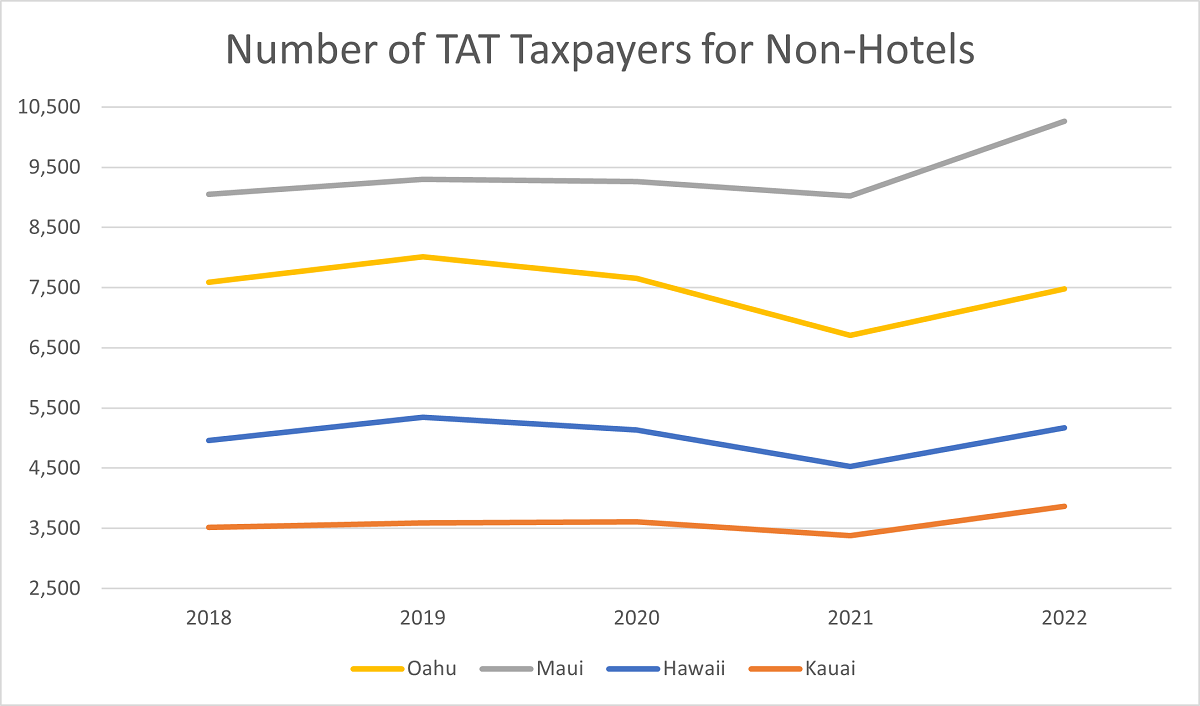
Another reason for Oahu’s poor performance is the ban on transient vacation units like Airbnbs and VRBOs outside of designated of resort areas. Oahu’s share of TAT revenue declined because visitors have fewer places to stay. In 2019, there were 8,015 TAT non-hotel taxpayers on Oahu. In 2022, that number dropped to 7,483. By contrast, the amount of non-hotel TAT taxpayers in Maui increased from 9,353 to 10,260. Figure 1 shows the change in non-hotel TAT taxpayers by island. While the number of transient vacation rentals increased in Maui and Kauai, they decreased in Oahu. Thus, one reason Oahu fared worse in attracting visitors is the ban on transient vacation units.
Figure 1:

1 The counties can levy an additional 3% on the TAT as county surcharge, but this amount has been omitted for this analysis.